This tutorial is adapted from Web Age course Microservices Development Bootcamp with Immersive Project.
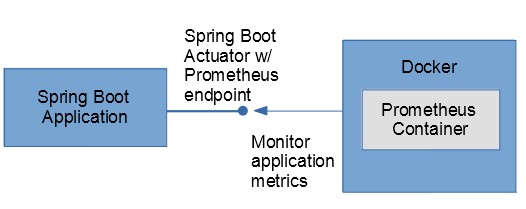
In this tutorial, you will use Prometheus to monitor a Spring Boot application. You will configure the Spring Boot application to enable metrics gathering via Spring Boot Actuators and expose Prometheus endpoint. Then, you will run Prometheus in a Docker container and configure it to monitor your Spring Boot application.
 Part 1 – Setting the Stage
Before you start working on this tutorial:
- Ensure Docker is installed and configured.
- Run the following commands to pull Docker images required to use Prometheus
- docker pull prom/prometheus:v2.10.0
- docker pull grafana/grafana:6.2.2
In this part, you will create a directory and copy an existing project to it.
1. Open a new Terminal window by clicking Applications > Terminal.
2. Create a directory where you will copy the Spring Boot application:
mkdir -p /home/wasadmin/TutorialWorks
3. Switch to the directory:
cd /home/wasadmin/TutorialWorks
4. Download the application from here. Unzip the existing application:
unzip /home/wasadmin/TutorialFiles/employees-rest-service
5. Switch to the project directory:
cd employees-rest-service
Part 2 – Explore an Existing Spring Boot Application
In this part, you will explore an existing Spring Boot application.
1. Build and run the sample project:
mvn clean install spring-boot:run
Wait until the application is started.
2. From Application menu, open Firefox web browser.
3. Navigate to the following URL:
http://localhost:8080/employees/
Note: Don’t forget to type in the / at the end.
The URL accesses Customers services implemented in the sample application. The service returns data in JSON format and it looks like this:
 4. In the terminal where Spring Boot application is running, press Ctrl+C to stop the application.
5. Using gedit or vi/nano text editors, browse the code in the following files:
src/main/java/com/webage/rest/model/Employee.java
src/main/java/com/webage/rest/model/Employees.java
src/main/java/com/webage/rest/dao/EmployeeDAO.java
src/main/java/com/webage/rest/controller/EmployeeController.java
Note:
model folder contains the models (Employee and Employees).
dao folder contains Data Access Object which populates the data.
controller folder contains the REST service(s).
Part 3 – Add Prometheus Dependencies to the Project
In this part, you will modify pom.xml and add Prometheus dependencies to the project.
1. Open pom.xml:
gedit pom.xml
2. In the dependencies tag, add Actuator dependency:
<dependency> <groupId>org.springframework.boot</groupId> <artifactId>spring-boot-starter-actuator</artifactId> </dependency>
To enable Spring Boot Actuator, you add the spring-boot-actuator dependency. Actuator dependency enables various features, such as monitoring app, gathering metrics, understanding traffic or the state of database.
3. In the dependencies tag, add Prometheus dependency:
<dependency>
  <groupId>io.micrometer</groupId>
  <artifactId>micrometer-registry-prometheus</artifactId>
</dependency>
To integrate actuator with Prometheus, you need to add the micrometer-registry-prometheus dependency. Spring Boot uses Micrometer, an application metrics facade to integrate actuator metrics with external monitoring systems. It supports several monitoring systems like Netflix Atlas, AWS Cloudwatch, Datadog, InfluxData, SignalFx, Graphite, Wavefront, Prometheus etc.
4. Save and close pom.xml.
5. In the terminal, run the following command to start up your application:
mvn clean install spring-boot:run
6. In the web browser window, type the following URL:
http://localhost:8080/actuator
Notice the default endpoints exposed over the HTTP protocol look like this:
 Prometheus endpoints are not exposed by default.
7. In the terminal, press Ctrl+C to stop your application.
Part 4 – Modify Spring Boot Application Properties
In this part, you will modify Spring Boot application properties to enable monitoring of various actuators.
1. Create a directory where you will store application properties:
mkdir src/main/resources
2. Create application properties file:
gedit src/main/resources/application.properties
3. Enter the following content in the editor:
management.security.enabled=false
management.metrics.export.prometheus.enabled: true
management.endpoints.web.exposure.include=*
management.endpoints.web.exposure.exclude=
management.endpoints.jmx.exposure.include=*
management.endpoints.jmx.exposure.exclude=
These lines enable Prometheus metrics that you can view over HTTP and also JMX.
4. Save the file and exit gedit.
5. Rebuild and run your application:
mvn clean install spring-boot:run
6. In the web browser, enter the following URL:
http://localhost:8080/actuator
Notice there’s a huge list of endpoints available.
7. Browse through the list and notice Prometheus is also available.
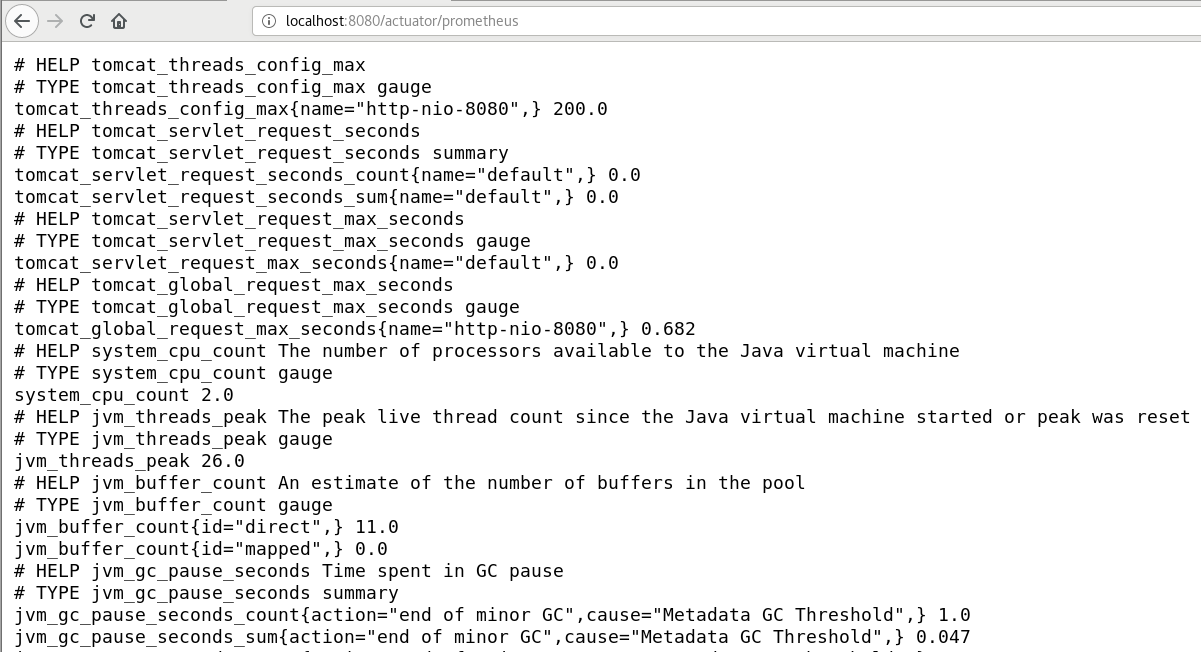
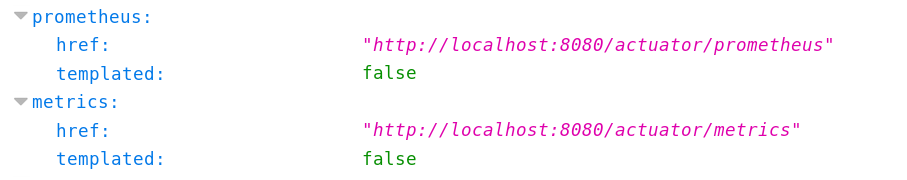 8. In the web browser, enter the following URL:
http://localhost:8080/actuator/prometheus
Notice there are various metrics available which can be monitored. You will do so later in this tutorial.
Part 5 – Create a Prometheus Configuration File
In this part, you will configure Prometheus to scrape metrics data from Spring Boot Actuator’s /prometheus endpoint.
1. Open a new Terminal.
2. Before you create Prometheus configuration file, option the host IP address. Run the following command and make a note of your host’s IP address:
ifconfig | grep netmask | grep broadcast
3. Create a folder to save Prometheus configure file:
mkdir /home/wasadmin/TutorialWorks/prometheus
4. Use gedit to create a file named prometheus.yml:
gedit /home/wasadmin/TutorialWorks/prometheus/prometheus.yml
5. Enter the following contents to the file: (Note: Don’t forget to substitute the HOST_IP which made a note of in step 5. Also, ensure you indent the code properly)
scrape_configs:
  - job_name: 'prometheus'
    static_configs:
    - targets:
  - job_name: 'spring-actuator'
    metrics_path: '/actuator/prometheus'
    scrape_interval: 5s
    static_configs:
    - targets:
Note: These lines specify the following:
* Prometheus will run on port 9090
* It’s going to allow you to monitor Spring Boot actuator at /actuator/prometheus
* The application you want to run is located at HOST_IP:8080
6. Save the file and exit gedit.
Part 6 – Run Prometheus and Monitor your Application
In this part, you will run Prometheus. Prometheus is available in one of the docker images, which is preloaded on your machines.
1. Run the following command to start up Prometheus in a container: (Note: It’s a single statement)
sudo docker run -d --name=prometheus -p 9090:9090 -v /home/wasadmin/TutorialWorks/prometheus/prometheus.yml:/etc/prometheus/prometheus.yml prom/prometheus --config.file=/etc/prometheus/prometheus.yml
2. If you are prompted for a password, enter wasadmin
3. Ensure there are no errors in the terminal, wait for a few seconds, and run the following command to verify Prometheus container has started:
sudo docker ps -a
4. It should show you Prometheus container like this:
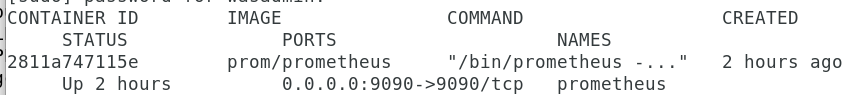
5. In the web browser window, open a new tab, and enter the following URL:
http://localhost:9090
It should look like this:
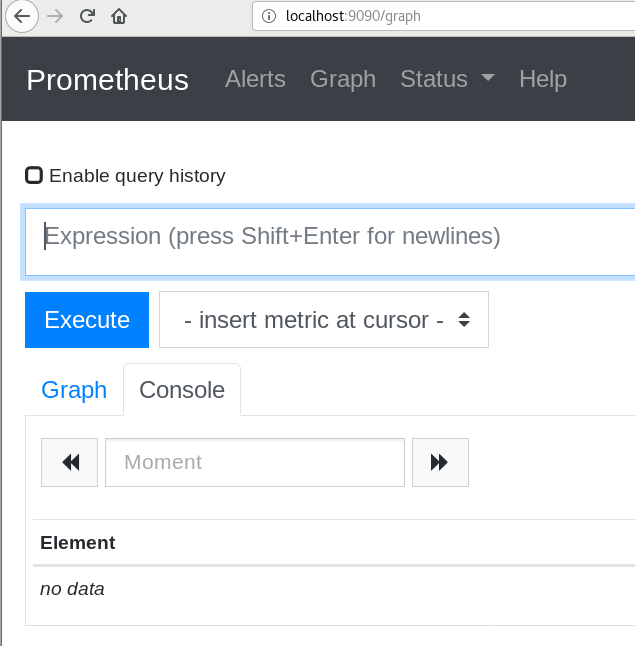 6. In Expression textbox, enter the following:
process_uptime_seconds
Note: It’s one of the metrics which is exposed over /actuator/prometheus endpoint. It shows you how long the application has been running. You can navigate to http://localhost:8080/actuator/prometheus and search for it. There are also several other metrics which can be monitored.
7. Press Execute button
Notice a graph shows up under Graph tab. You can customize the time-period by pressing + and – buttons
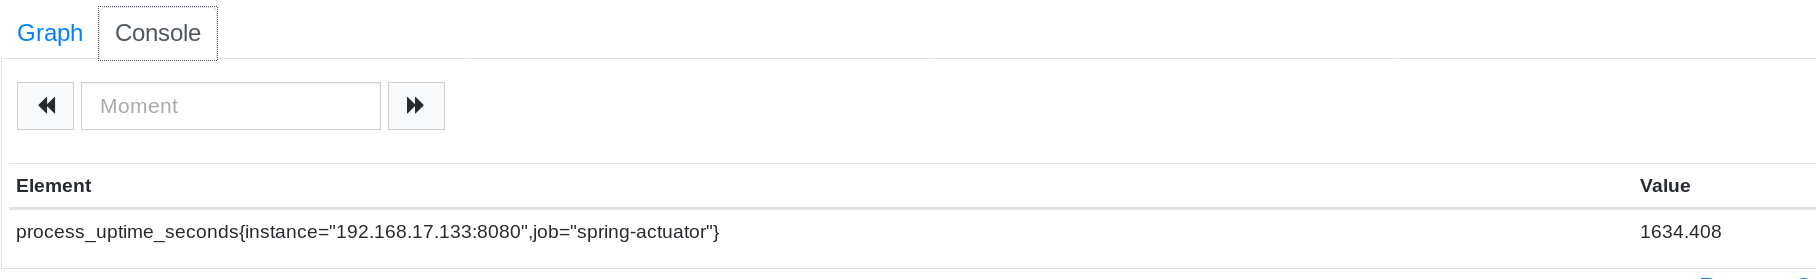
 8. Click Console tab to see the text version of the metrics.
 9. Switch back to Graph tab.
10. In Expression text box, enter the following, and press Execute:
system_cpu_usage
11. It will show you CPU usage.
12. In Expression text box, enter the following, and press Execute:
http_server_requests_seconds_max{method="GET",status="200",uri="/employees/"}
13. It will show REST service response latency. It can be helpful to find slow APIs/REST services.
Note: If you don’ see any graph, open a tab in the web browser, and enter the URL: http://localhost:8080/employees/ and refresh the page a few times.
Part 7 – Clean-Up
In this part, you will stop Prometheus and your application.
1. Run the following command to stop Prometheus container:
sudo docker stop prometheus
If prompted for a password, enter wasadmin
2. Remove Prometheus container:
sudo docker rm prometheus
If prompted for a password, enter wasadmin
3. Switch to the terminal where Spring Boot application is running and press Ctrl+C to stop the application.
4. Close web browser tabs where Prometheus is running.
5. Close the Terminal windows.
Part 8 – Review
In this tutorial, you used Prometheus to monitor a Spring Boot application.