SQL Server 2012 brings Power View (aka. Project Crescent) which supports highlight filter and slicers. They are pretty much similar to PowerPivot. Let’s discuss when these features should be used
Let’s take the following scenario where we have a table as well a chart on the same Power View report:
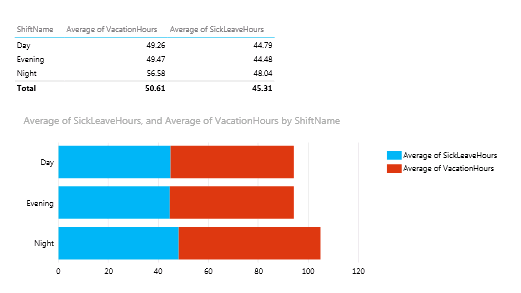
Highlight:
It let’s you focus on the interested data. If you highlight a table it won’t do much except for highlighting the cell in the table.
But, if you highlight a bar in the chart then it filters the table control automatically

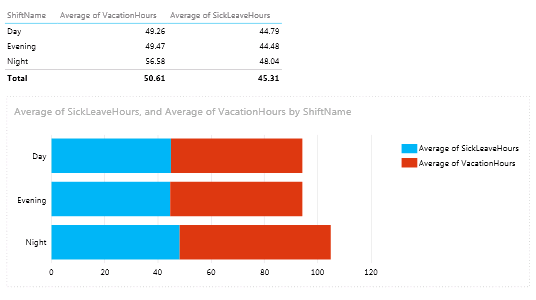
Filter:
Filter can be utilized at individual control level e.g. table, matrix, card, chart etc. It cuts down on the data that’s being displayed on the Power View canvas. Filter at control level doesn’t effect other controls on the canvas.
Here’s the filter applied on table (Note: applying filter on chart will have similar effect):

One benefit of filter is that it has it’s own section (the right hand side window which can be closed or opened) where it gets displayed so it doesn’t consume real estate on the screen, well at least not all the time. You can choose to display filter pane whenever you require it.
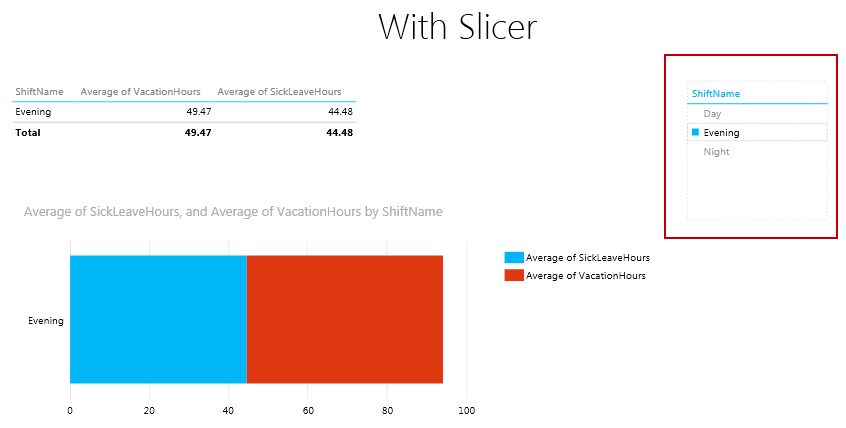
Slicer:
Slicer is a filter but it’s scope is broader than a filter. Slicer filters data at the View level. One drawback of slicer is that it’s always displayed in the Power View canvas which means it reduces the real estate on the screen for controls that we can use.
Here we have a slicer on the right hand side and it filters all the controls on the canvas:
Summary:
- Use highlight for showing areas of interest as well for filtering (especially chart control)
- Use filter when you have to filter individual controls without effecting other controls
- Use slicer when you have to filter everything on the canvas