Power Builder, PowerPivot. Let me guess what word is common in these technologies ,“POWER”. Quite a few products and technologies have used the word “Power” to give a sense of empowerment to the users. And, I guess they deserve to use the name as they have delivered the results. Now there’s another one to join the family and that’s Power View (aka. Project Crescent) in SQL Server 2012.
So far Power View seems pretty good. It does empower the end users. Here’s the requirements for using Power View:
- SharePoint 2010 Enterprise edition with SP1
- SQL Server 2012 PowerPivot (SharePoint must be configured as well)
- Silverlight 5 (What?? No HTML 5 or AJAX??
 )
)
Yes, you read it right. It’s a Silverlight 5 based application and it won’t run on iOS. That’s where Microsoft should have offered AJAX alternative as well so those who don’t have Silverlight plug-in could use it as well. If you could just come over this one itsy bitsy drawback Power View is definitely an excellent self-servicing BI feature for business users.
As far as data source goes, Power View requires one of the following:
- Tabular Model (New in SSAS 2012)
- PowerPivot based Excel report (this could use OLTP, OLAP or Tabular Model)
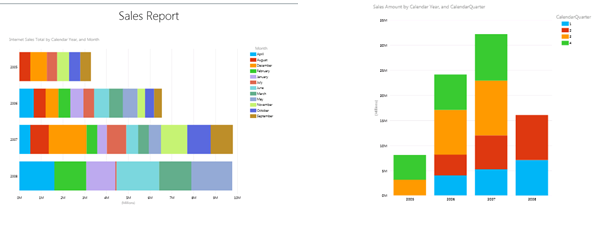
Here are some of the graphical visualizations that we can create in Power View:
- Charts (Horizontal and Vertical)
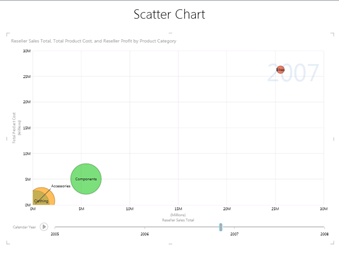
- Scatter Chart (with Play Axis. Simply love the animation for showing breakdown of the data over period of time)
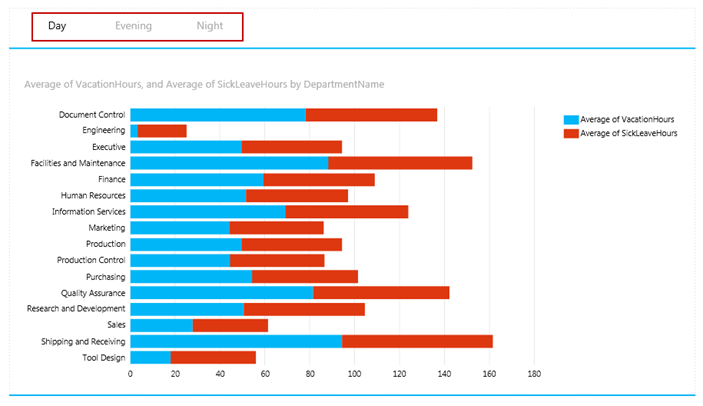
- Charts (with Tiles)
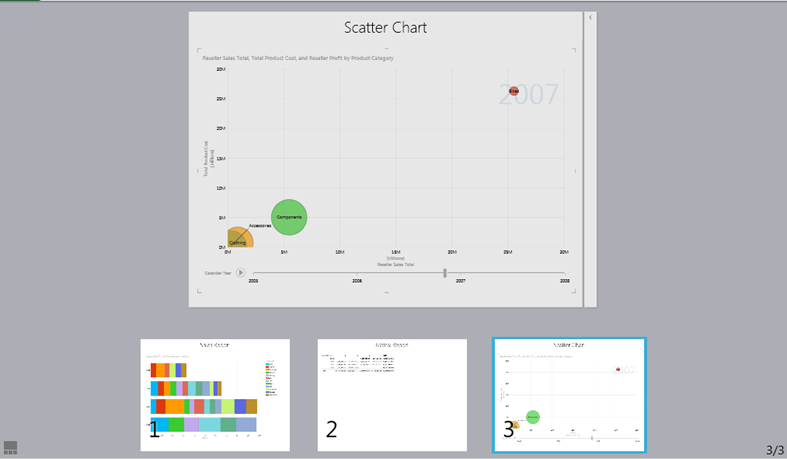
- Views (OK, this is not really a visualization since it’s available out-of-the-box but I just got to mention it since it’s soooooo good. Just like Excel has sheets concept, PowerPoint has slides concept the Power View has views concept. It lets you add multiple views of the data in the same report. You could say that it’s Power View’s equivalent to Sub-report in SSRS)
Here are the pros, cons and the personal verdict (it’s by no means an exhaustive list of pros and cons)
Pros:
- Easy to create reports in a matter of minutes
- No programming / SQL knowledge is required
- Out-of-the-Box animations and visualizations (Play Axis stole my heart away)
- Easy to filter reports at control level or at the report level
Cons:
- Uses Silverlight plug-in
- Yet to see any support for creating custom extensions or plug-ins to develop custom visualizations and animations
Personal Verdict:
Excellent reporting tool for business users and delivers well considering it’s the first iteration of Power View. Definitely looking forward to it’s future iterations.