In this tutorial you will get hands-on experience with:
-
Template parse errors
-
Typescript code errors
-
Accessing components at runtime with ng.probe()
-
Breakpointing in Typescript code
Before you start working on this tutorial, install the required software as mentioned in the Set Up Guide here.
Part 1 – Get Started
1.Create C:\LabWork folder in your machine.
2. Download rest-client and rest-server zip files and extract each file to C:\LabWork folder on your machine
3. From C:\LabWork\rest-client start the development server.
npm start4. From C:\LabFiles\rest-server folder start the backend web service server.
npm start5. Open a browser and enter the URL: http://localhost:4200 and make sure you can use the app normally.
6. Open the browser developer tool (F12) and the Console pane. We will use the console a lot.
Part 2 – Simulate Typescript Compile Errors
1. Open C:/LabWork/rest-client/src/app/edit-book/edit-book.component.ts.
2. In the EditBookComponent class add a variable with obvious compilation error.
badVar:number = "hello";You can add this var before the “constructor()” line.
This statement tries to assign a string to a number type variable. It should produce a TypeScript compile error.
3. Save changes.
4. Compile problems are reported in the development server console. You should see this message:

5. Also verify that the browser was not updated. The development server does not push code if build fails.
6. Remove the newly added variable and save changes and make sure that there are no more compile problems.
Part 3 – Simulate Template Errors
Syntax errors in the template are not reported by the dev server. They are discovered at runtime and reported in the browser console.
1. Open book-list/book-list.component.html.
2. Change the first *ngIf to *if (line 6).
3. Save.
4. Notice that the dev server compiles the code just fine.
5. Back in the browser you will see a blank page. The console should show the actual error.
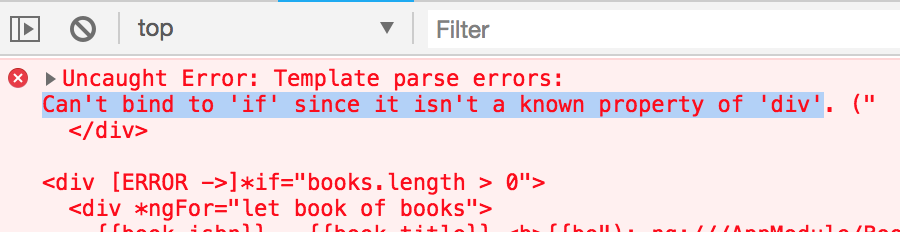
Important
During development always watch the dev server output as well as the browser console. Problems can be reported in either of these places.
6. Fix the problem (change if back to ngIf). Make sure that the app is working properly.
Part 4 – Putting a Break Point
Learning how to put a break point in Typescript code is an essential skill. This will help you investigate difficult problems using the debugger tool.
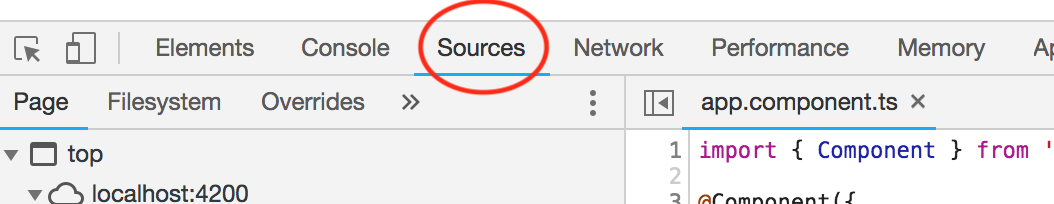
1. Open book-list/book-list.component.ts in an editor. We will put a break point in the deleteBook() method.
2. In the browser’s developer tool, click the Sources tab.
3. To search for a file hit Control+P (Cmd+P in Mac). Start typing book-list.
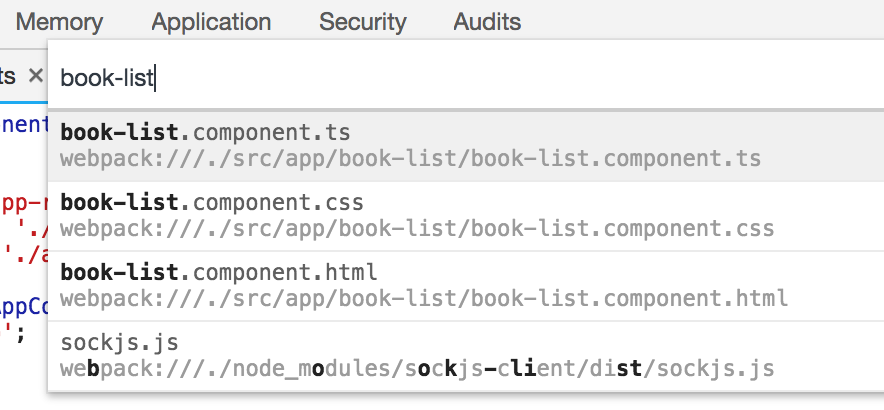
4. Pick book-list.component.ts.
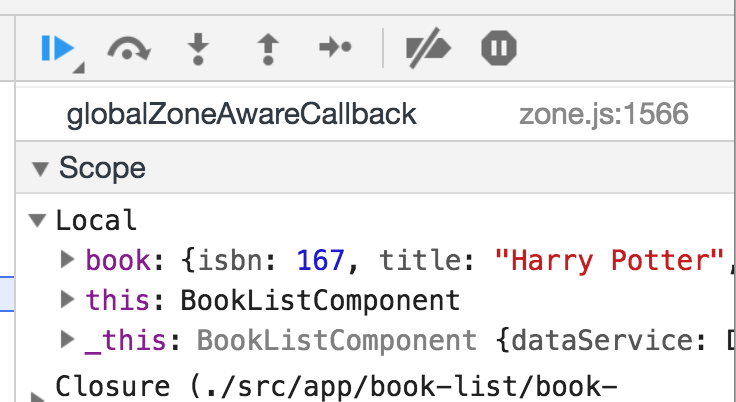
5. Put a break point in the first line of deleteBook() method. (line numbers in your code may differ from those in the screenshot below)
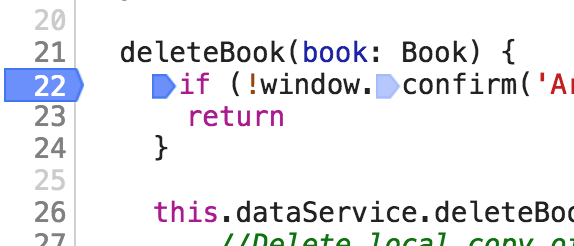
6. In the application, click the DELETE button for a book. You should now halt at the break point.
7. In the variables pane under local Scope you should be able to inspect the book variable. The this variable points to the instance of BookListComponent.
8. Hit the resume  button to continue. Click OK or Cancel.
Part 5 – Use ng.probe
This is an easy way to inspect the internal state of a component without using a debugger. If you have many components on a page you can precisely select the one you wish to inspect.
1. In the application, click the EDIT button for a book. You will now be routed to the EditBookComponent. We will inspect its internal state.
2. In the browser’s developer tool click the Elements tab.
3. Click the Select button.

4. Then click on one of the form input boxes. You can click anywhere within the boundary of the component.
5. Switch back the Console tab in the developer tool.
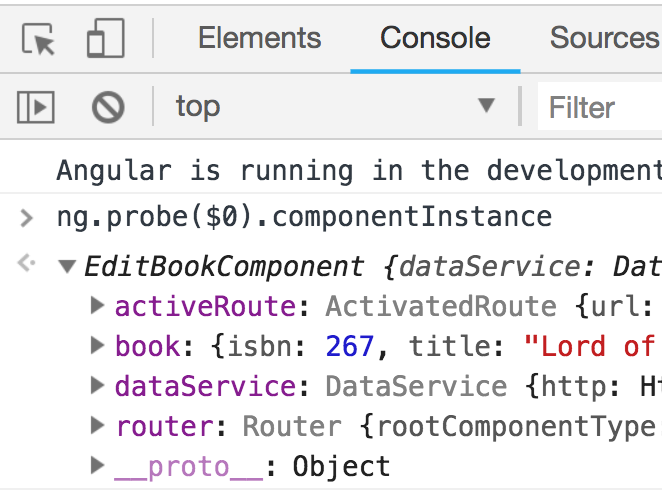
6. Type this and hit enter:
ng.probe($0).componentInstance7. You should now be able to expand the instance of EditBookComponent and look at its internal state (such as the book variable).
8. In both command prompt windows, hit Control+C .
9. Close all.
Part 6 – Review
In the tutorial, we learned a few common techniques to investigate errors in Angular applications.